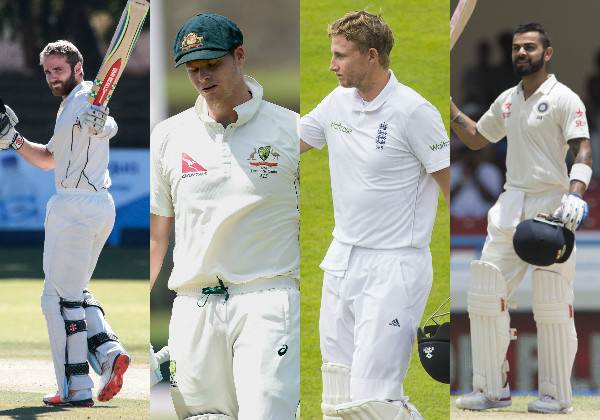
Statistical Analysis: Smith, Kohli, Williamson, Root and others in Test cricket since 2010
A statistical comparison of the batsmen since January 2010 considering their home and away records, conversion rates and batting averages.
2 Min Read


The hottest debate among the cricketing circles at the moment is regarding the best batsman in the Test cricket among the current generation. Some like to pick out the best based on the batting averages, few look towards player’s conversion rates of the 50s to 100s and big centuries while some others consider player’s performances at home and outside home. The debates got spiced up with Virat Kohli, Steven Smith, Kane Williamson and Joe Root, who are considered to be the best in the world among the lot, are in the action as captains of their respective teams at the moment.
Smith and Root are part of the Ashes series while Kohli leading India against Sri Lanka. Williamson will be on the field this week when New Zealand takes on West Indies. With the Ashes series lasting till January and India touring South Africa, the discussions regarding the best batters of this generation might peak up. Ahead of these, CricTracker brings a statistical comparison of the batsmen since January 2010 considering their home and away records, conversion rates and batting averages.
![]()
Conversion Ratio:
Kohli’s conversion rate is one of the most spoken things at the moment as the India skipper has 19 centuries against 14 fifties in this format. His recent conversion of his fifties to centuries and big innings puts him on the top in conversion rates. In a space of 492 days, Virat Kohli scored five double hundreds, the shortest span for any player in Test history. Smith is the 2nd best among the four while Root lacks in this aspect. The New England skipper managed to convert only 13 of his 46 fifty-plus scores so far. Sangakkara tops this list with a conversion ratio of 0.349, which is a representative to the chance of him scoring a fifty and converting it to a big hundred whenever he batted.
Best conversion ratio since January 1, 2010:
![]()
(List is an extract of 22 players with 25+ fifty-plus scores)
(Note: The ratio here is the product of Inns/fifty-plus score and cumulative conversion rates of 100s, 150s and 200s)
Average Factor:
Since the start of 2010, the average for a batsman in Tests at home is 34.9 while outside home it comes down to 29.4. Based on this, by equating the players’ averages at home, outside the home and their overall averages, Steven Smith tops the list with an average factor of 1.753 which is a value of his every run irrespective of home or away. The remaining three players had similar factors only to be separated by decimals. In fact, Smith’s average outside home of 53.95 is higher than Kohli, Root and Williamson’s career batting averages.
Best average factor since January 1, 2010:
![]()
(List is an extract of 45 players with 1000 runs at home and away)
(Note: The Average Factor is a product of the players’ career averages and their neutralized home and away averages, done using the overall Test cricket average of these seven years.)
The product:
After mixing up the conversion ratios and averages factors, Smith attained a value of 0.486, the 2nd best after Kumar Sangakkara’s 0.605 in Test cricket since 2010. Kohli stands next to Smith among the fab four with a value of 0.436. Williamson and Root are well separated from the Australian and Indian skippers with the values of 0.305 and 0.278 respectively. Smith, by performing at home and away and Kohli by virtue of extraordinary conversion rates occupied the top positions respectively while Root, due to a below-par conversion rate, stayed at the bottom among the four. Kane Williamson, who was decent in both the averages and conversion rates couldn’t make it ahead of Smith and Kohli.
Best conversion*average value since January 1, 2010:
![]()
(List is an extract of 21 players with 25+ fifty-plus scores and 1000 runs at home and away)
(Note: The resultant value is the product of Conversion factor and average factor)
*UAE is considered as Pakistan’s home*
(Stats as on November 30, 2017)
Download Our App